
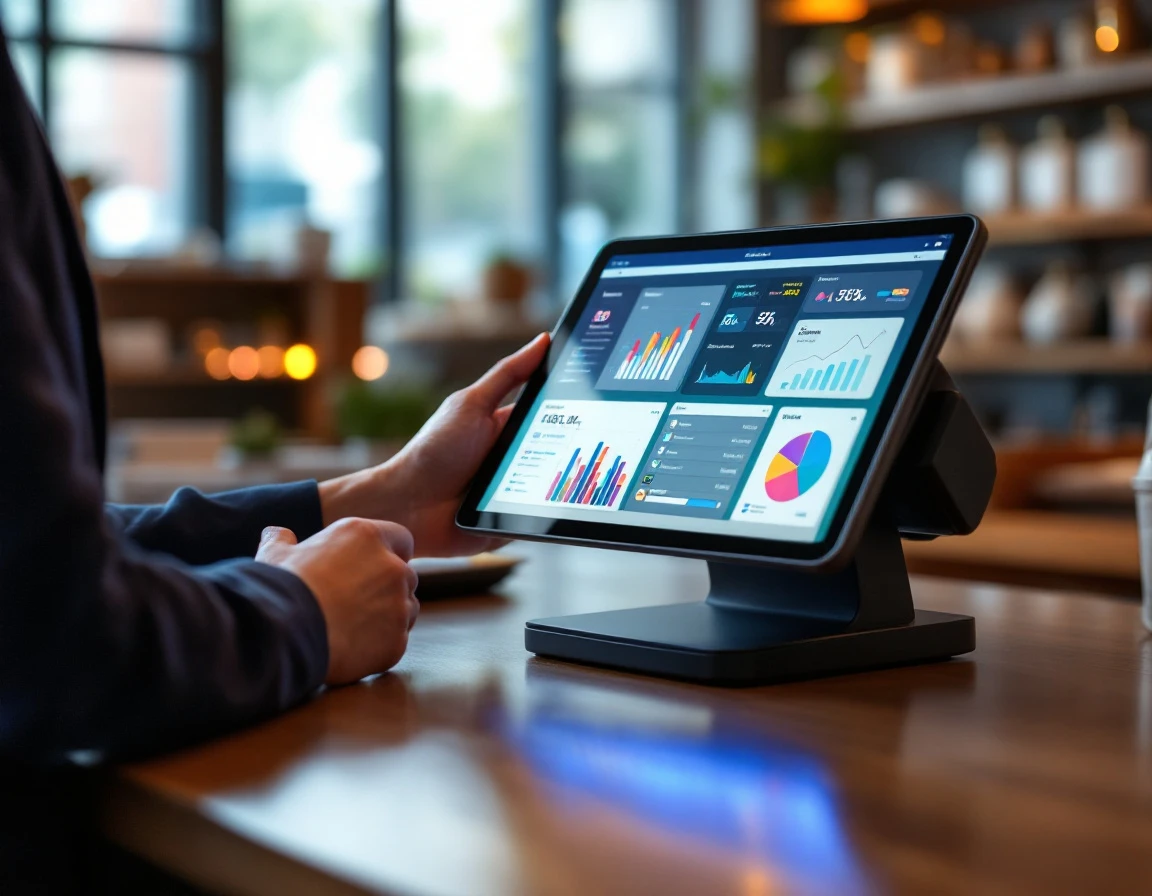
Why June Matters for Retail Health
You've run your store for six months. Some patterns are working. Others are quietly draining profit. June sits at the pivot point where you can still act on what the data tells you before the second-half rush begins. Understanding your POS metrics for retail stores at this moment gives you the edge to correct course before peak season hits.
The numbers don't lie. Six months of transaction history reveals which services drive repeat visits, which inventory turns slowly, and where labor costs spike without matching revenue. These trends have solidified enough to be reliable, but you still have five to seven months for corrections to compound before November's holiday surge.
Spot problems now, and you adjust staffing before back-to-school traffic hits. Identify underperforming SKUs, and you redirect shelf space before holiday ordering locks you in. Wait until September, and you're fighting fires instead of building momentum. The stores that treat June as a checkpoint rather than just another month enter Q3 with clear priorities instead of vague hopes.
A focused review of seven core POS metrics takes a morning. The payoff shows up as 8–15% higher revenue through year-end because you're allocating resources based on proven patterns rather than gut feeling.
Seven Essential POS Metrics to Review in Your Retail Store
Your POS system captures thousands of data points every day, but seven core metrics reveal whether your store is operating efficiently or leaving money on the table. These numbers serve as your operational dashboard — each one exposes a different dimension of store health that you can address before peak season arrives.
- Transaction count and basket size measure how many customers visit and how much they buy per trip. Rising transaction counts with shrinking basket sizes often signal customers are comparison-shopping or hesitating on larger purchases. Find these figures in your POS reporting dashboard under sales summary or transaction history.
- Average transaction value shows whether your pricing and upsell efforts are working. A declining average means customers are trading down to cheaper items or skipping add-ons. Most systems display this metric on the main sales report, calculated as total revenue divided by transaction count.
- Gross profit margin by category breaks down which product lines actually make money after accounting for cost of goods sold. Shipping supplies might generate high volume but thin margins, while notary services deliver stronger profitability. Look for category-level profit reports in your accounting or inventory module.
- Inventory turnover rate identifies products sitting on shelves too long, tying up cash that could fund faster-moving stock. Calculate this by dividing cost of goods sold by average inventory value, or pull it from your inventory analytics section.
- Sales per square foot benchmarks your store's productivity against retail category standards. Divide total revenue by your sales floor square footage to see if you're maximizing space efficiency. This requires manual calculation unless your POS includes footprint tracking.
- Peak hours and transaction timing reveal when customers actually shop, guiding staffing schedules and supply restocking. Check your POS hourly sales breakdown or traffic pattern reports.
- Payment method mix shows whether customers prefer cards, mobile payments, or cash. A sudden shift might indicate friction at checkout or changing customer demographics. Review this in your payment processing reports or tender type summary.
Healthy Benchmarks by Retail Category
These benchmarks represent the thresholds separating thriving stores from struggling ones — they're not industry averages but targets that indicate operational health. Store owners should compare their June metrics against these ranges to identify gaps before the second half of the year begins.
Apparel and fashion stores typically operate on gross margins between 35 and 50 percent, with inventory turning 4 to 6 times annually. Sales per square foot should reach $150 to $300, while average transaction values range from $25 to $60 depending on product mix and pricing tier.
General merchandise and convenience stores run on tighter margins — 25 to 35 percent — but compensate with faster inventory turns of 8 to 12 cycles per year. Target sales per square foot fall between $100 and $250, with average transactions in the $15 to $40 range reflecting higher transaction frequency but lower ticket sizes.
Specialty retail — including gifts, home décor, and sporting goods — commands the highest margins at 40 to 55 percent, though inventory moves more slowly at 3 to 5 turns annually. These categories should aim for $200 to $400 per square foot given their premium positioning.
Transaction count benchmarks shift by location type. High-traffic urban stores handle 150 to 300 daily transactions, suburban locations process 50 to 120, and small-town stores see 20 to 60. Store owners should self-select their tier based on foot traffic patterns rather than aspirational comparisons.
Where Problems Hide in the Data
Raw numbers rarely tell the full story. A store that sees transaction count climb 12 percent while average transaction value drops 8 percent isn't necessarily healthier — it may signal that staff aren't suggesting add-ons, or that customers are cherry-picking sale items without browsing full-priced inventory. Learning to spot these metric mismatches transforms surface-level reporting into diagnostic insight.
Declining average transaction value often points to weak upsell training or a seasonal demand drop. When customers leave with fewer items per visit, review your counter prompts and product placement near the register. Flat or falling inventory turnover reveals overstocking, discontinued lines sitting on shelves, or pricing that no longer aligns with customer expectations. Calculate turnover by category, not just store-wide, to find which product families are dragging performance.
Mismatched peak hours and staffing rosters suggest scheduling inefficiency or missed sales opportunities. If your POS shows heavy traffic from 11 a.m. to 1 p.m. but you schedule most staff for late afternoon, customers wait longer and some walk out. Margin compression by category hints at excessive discounting, theft, or supplier cost increases — isolate the cause by reviewing discount frequency, shrinkage logs, and invoice history for that category.
Payment method clustering also reveals friction. A store where 80 percent of transactions are cash and 20 percent are card may have an outdated terminal or checkout process that discourages card use. Finally, seasonal product underperformance can hide beneath strong overall sales if you skip category-level analysis. Break sales down by product line to catch lagging items before they consume working capital through the second half.

From Metrics to Action: Q3–Q4 Optimization
Once you've identified which metrics fall short of benchmarks, convert each diagnosis into a concrete action you can complete before August.
- If inventory turnover is low. Liquidate slow-moving stock through clearance bins or themed bundles during the back-to-school window; then rebalance your Q4 orders to favor proven categories.
- If average transaction value lags. Implement a two-week staff training cycle on suggestive selling—pair high-margin accessories with core purchases and coach employees to mention complementary items at checkout.
- If peak-hour traffic exceeds staffing capacity, hire seasonal labor now before summer hiring windows close in mid-July. Adjust your schedule to match conversion-critical hours.
- If gross margins compress across categories. Audit supplier contracts for better terms, review markup rules by product line, and test small price increases on inelastic items like greeting cards or batteries.
Each of these interventions, executed in June or early July, compounds over the next five months and drives the 8–15% revenue lift your second-half performance depends on.
Service Mix and Omnichannel Readiness
Your POS data already captures which add-on services generate margin and bring customers back. Review June performance for shipping consolidation, gift wrapping, alterations, printing, and custom services in your service mix analysis. The highest-margin offerings often take five minutes or less but command premiums because customers value convenience over price. Track frequency and average ticket lift for each service to identify which ones deserve prominent counter placement before holiday volume begins.
Watch for omnichannel signals hiding in transaction notes and staff reports. When customers ask about online ordering, cross-location inventory checks, or buy-online-pickup-in-store options your current system can't support, you're leaving revenue on the table. Similarly, payment flexibility matters: if customers request digital wallets, Buy Now Pay Later, or contactless options your terminal doesn't accept, competitors with modern payment rails will capture that business during peak season.
Identify staff skill gaps now, before November pressure exposes them. New services require training time that disappears once holiday traffic arrives.
Build Your Review Checklist and Next Steps
Transform this diagnostic framework into action with a five-step checklist you can execute this week:
- Pull historical POS data for January through June and establish baseline metrics for each category covered—transaction count, average transaction value, gross profit by category, inventory turnover, sales per square foot, peak hours, and payment mix. Export these numbers into a simple tracking spreadsheet or dashboard.
- Compare your current month metrics against the benchmarks provided earlier and identify the two to three most critical gaps holding back profitability.
- Assign accountability: designate one metric to each team lead to monitor and optimize through Q3 and Q4. When ownership is clear, improvement becomes measurable.
- Schedule follow-up reviews in August and October to measure the impact of your mid-year adjustments.
- Document your assumptions and baseline targets so you can measure September and December performance against June's numbers. This isn't a one-time exercise—successful owners monitor these key performance indicators for retail POS systems monthly and adjust tactics based on Q3 early results.
A modern POS system like ParcelPuffin makes ongoing metric tracking effortless, freeing you from manual data pulls and giving you real-time visibility into the levers that drive profit. The second half of 2026 will reward stores that act on data today.